Digital Twin
Every wall. Every system. Every risk, mapped.
We turn 3D facility models into operational intelligence. Your team inspects systems, understands consequence, and makes spending decisions from what they can actually see.
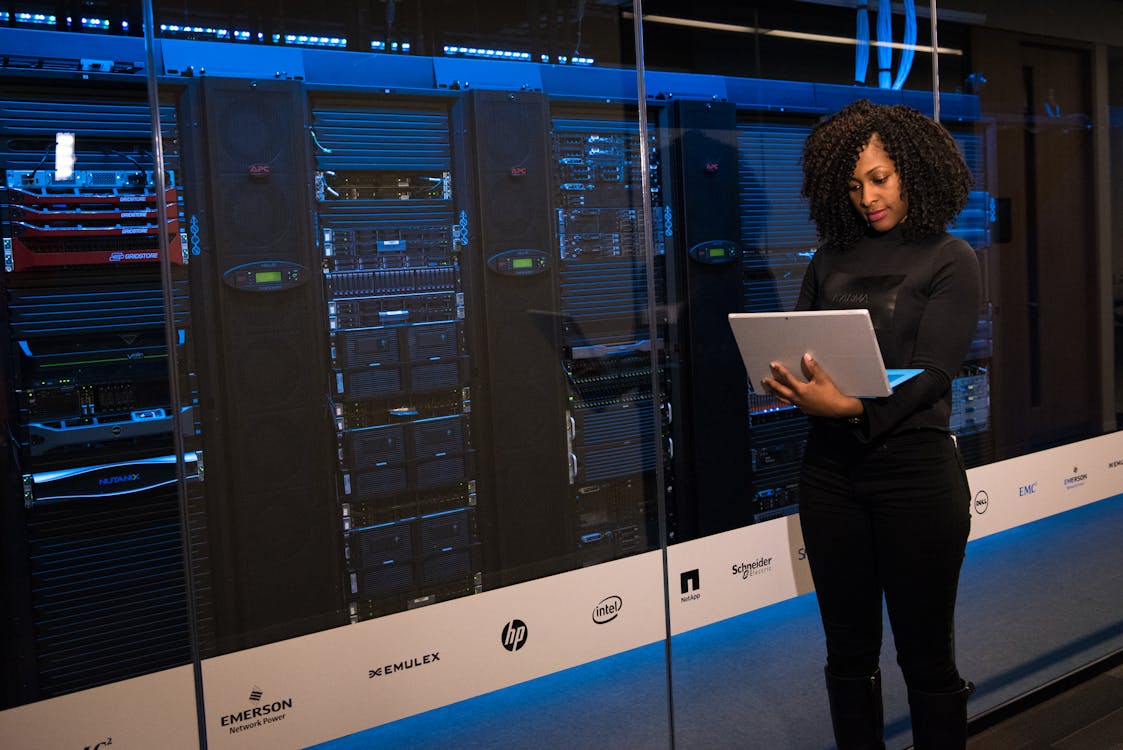
The asset isn't a row in a spreadsheet — it's a thing in a room.
Spreadsheets describe assets.
A twin shows where they live — and what they risk.
risk when systems are co-located but treated as independent.
A spreadsheet record never shows that the aging chiller and the backup generator share the same electrical panel.
inspections without a spatial reference for technicians.
When teams can't orient themselves quickly, field work slows down and errors compound.
capital requests fail to communicate physical infrastructure context.
Budget committees approve what they understand. Spatial evidence makes the ask concrete.
value from a CMMS where nobody can find the system they're looking at.
Data without location is an index without a map. The twin makes infrastructure legible.
Interactive Digital Twin
Every asset. Every component.
Live, explodable, actionable.
Loading HVAC Cluster
12-Month Risk Forecast
+18pts projectedHVAC Cluster
System sensors
LiveActive Flags
Every asset is connected.
The twin shows how.
Behind the 3D model is a graph database that maps every relationship in your facility — which systems feed which spaces, which assets share utility loops, and where a single failure propagates across buildings.
Asset → Space mapping
Every piece of equipment is linked to the space it serves. When a chiller goes down, you see the rooms and zones affected — not just a dot on a floor plan.
System dependency chains
Generators, transfer switches, distribution panels, and end loads form a chain. The graph traces that chain so risk scores reflect what actually depends on what.
Work order context
Every work order is tied to an asset, a location, and the systems around it. Technicians see the physical context before they arrive. Managers see the operational context before they approve.
Blast radius visualization
Select any asset and see its downstream impact — how many spaces, systems, and people are affected if it fails. This is what turns a maintenance ticket into a capital argument.
Shared infrastructure detection
Two buildings sharing a cooling tower. Three floors sharing a riser. The graph detects shared infrastructure so risk is scored at the dependency level, not the asset level.
Capital impact modeling
Replace one asset and the graph recalculates risk across every connected system. This is how the twin turns a replacement decision into a portfolio-wide impact assessment.
Three views. One facility.
Every one of them operational.
Rivolq's twin is not just a 3D object to navigate. Switch between the view that matches your role — field technician, facilities director, or budget conversation.
A floor plan overlay connects every asset to its physical location — room, floor, wing. Teams stop guessing which HVAC unit is which when work orders come in.
You don't need to model everything.
Start with what matters most.
Start with existing facility models
Upload GLB or GLTF files for the facility areas that matter most first. Rivolq does not require a giant campus-wide modeling exercise to begin.
Map assets and decision context
We connect the model to the equipment records, condition context, maintenance history, and risk inputs that make the twin useful — not just navigable.
Layer risk, inspection, and planning views
The result is not just a 3D object. It is a way to inspect systems, understand consequence, and move faster from field context to capital action.
See the twin with your own
facility context.
We'll look at the systems or spaces that matter most first, then show how Rivolq would connect the model to risk, maintenance, and planning views.